The Mathematics of Trading
1. Price Randomness
2. Price Factors
3. Technical Analysis
3.1. Chart Patterns
3.2. Market Indicators
4. Mathematical Expectancy
5. The Importance of Data in Trading
6. Risk Management
6.1. Risk of Ruin (ROR)
6.2. Optimal Risk
6.3. Calculating Position Size
6.4. Variable Risk
7. Parameters of a Trading System
8. TRADING COURSE
What do you know about trading? Can you beat the markets over time, or is it something impossible?
Do you believe mathematics can help you design a winning system, or is bankruptcy inevitable?
1. Price Randomness
They say that 90% of traders lose 90% of their money in the first 90 days, which isn’t very encouraging. But if many people lose, others must be winning, although… does that mean it’s possible to predict the price?
There are theories claiming that the price is completely random (Random walk) and the certainty that it doesn’t follow any known distribution. There is even the hypothesis that it’s impossible to anticipate it (efficient market), as markets are efficient and reflect all available advantageous information too quickly. This theory, which sounds quite good, was accepted and taught for many years.
But… since when do markets act only efficiently? Aren’t our emotions part of the game?
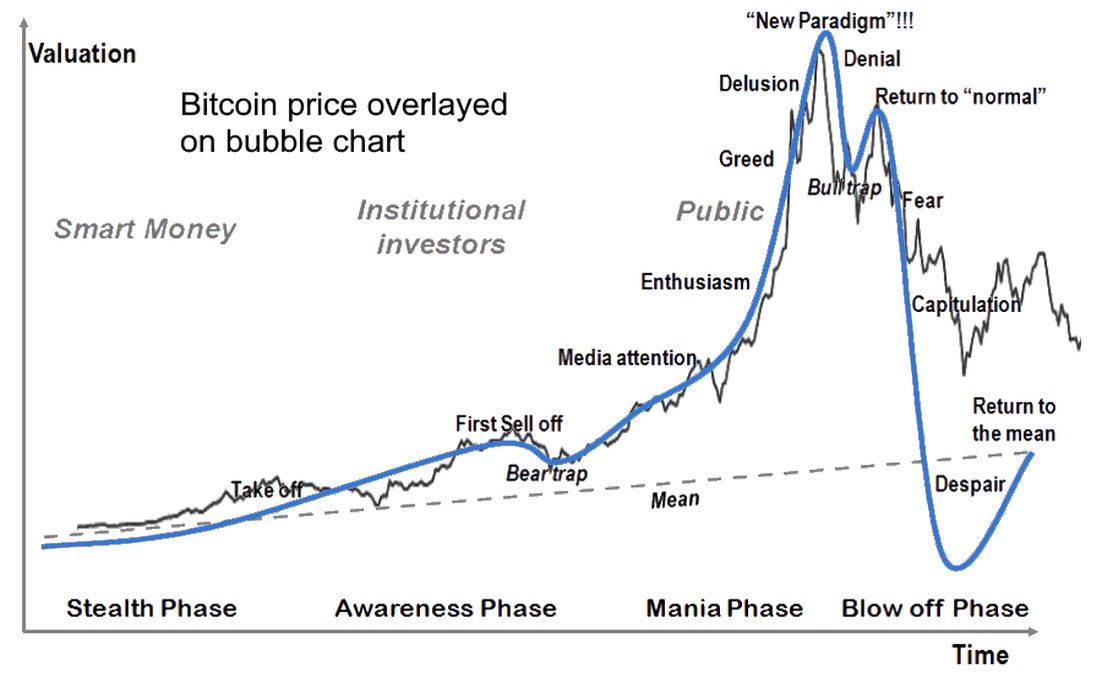
If we analyze what happens in a financial bubble, we can see a strong sense of euphoria is created, driving the price irrationally and ultimately leaving stocks overvalued. Something that cannot be explained by the efficient market model, because the price is always perfectly valued.
If we accept the emotional factor, we then have the Adaptive Market Hypothesis, which combines the best of both and better explains price behavior.
Although… how many factors actually influence the price?
2. Price Factors
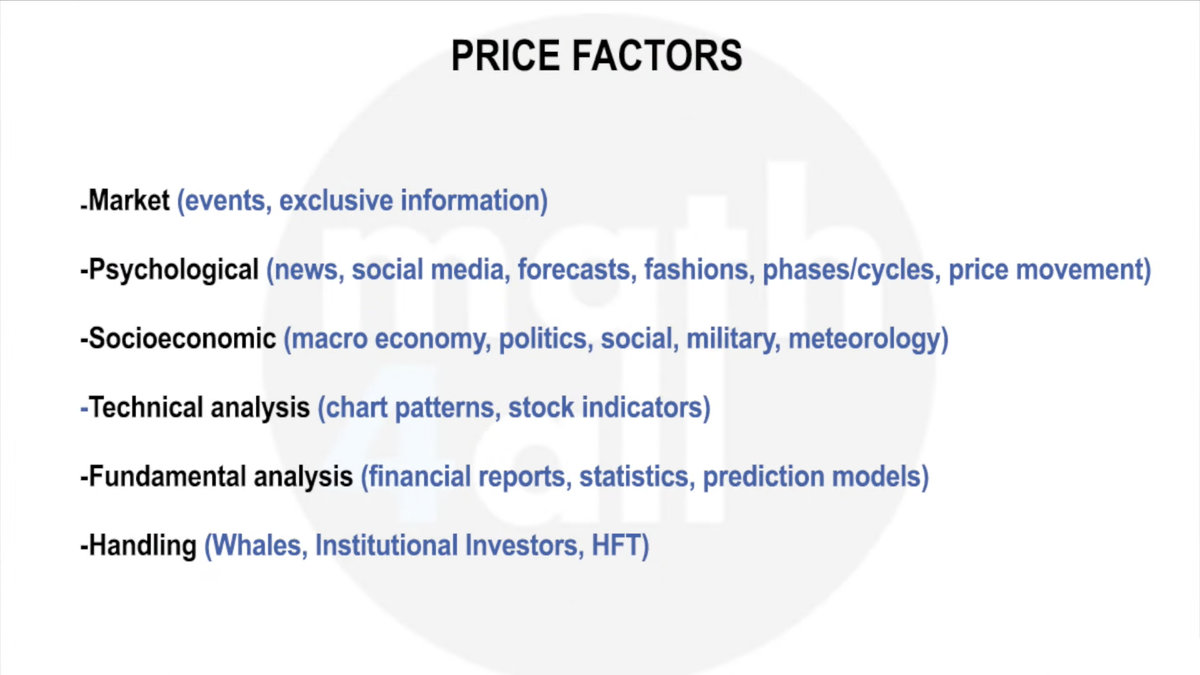
Here is a list where you can see most of them:
Screenshot
Some are highly psychological, such as news, social media posts, and even predictions themselves. It may seem strange, but the price itself influences the price—curious, right?
But one of the most influential factors is manipulation. The movements of large “whales” or groups of many investors can cause sharp rises and falls in a short time. By suddenly removing many sellers or buyers from the auction, the price takes on a very different value, which drags more investors to follow the movement, further expanding its effects.
The fact is, some factors are more influential than others.
But… how can mathematics help you in trading?
3. Technical Analysis
To analyze a market, you can focus on its peculiarities through fundamental analysis. For example, if you wanted to invest in Apple long-term, you would study its sales data, economic reports, and information relative to the company to develop a prediction of the true value of its shares.
In contrast, a trader focuses mainly on a technical analysis of the price because, according to Dow Theory, the history already displays all factors influencing it.
And here again, mathematics helps us… but what are those factors?
3.1 Chart Patterns
Technically analyzing a market involves analyzing price trends and their corrections to take advantage of them.
To do this, we draw trend lines, support and resistance, Fibonacci levels, or Elliott Waves, which are nothing more than graphic elements that mark patterns in the price and have a certain statistical success rate.
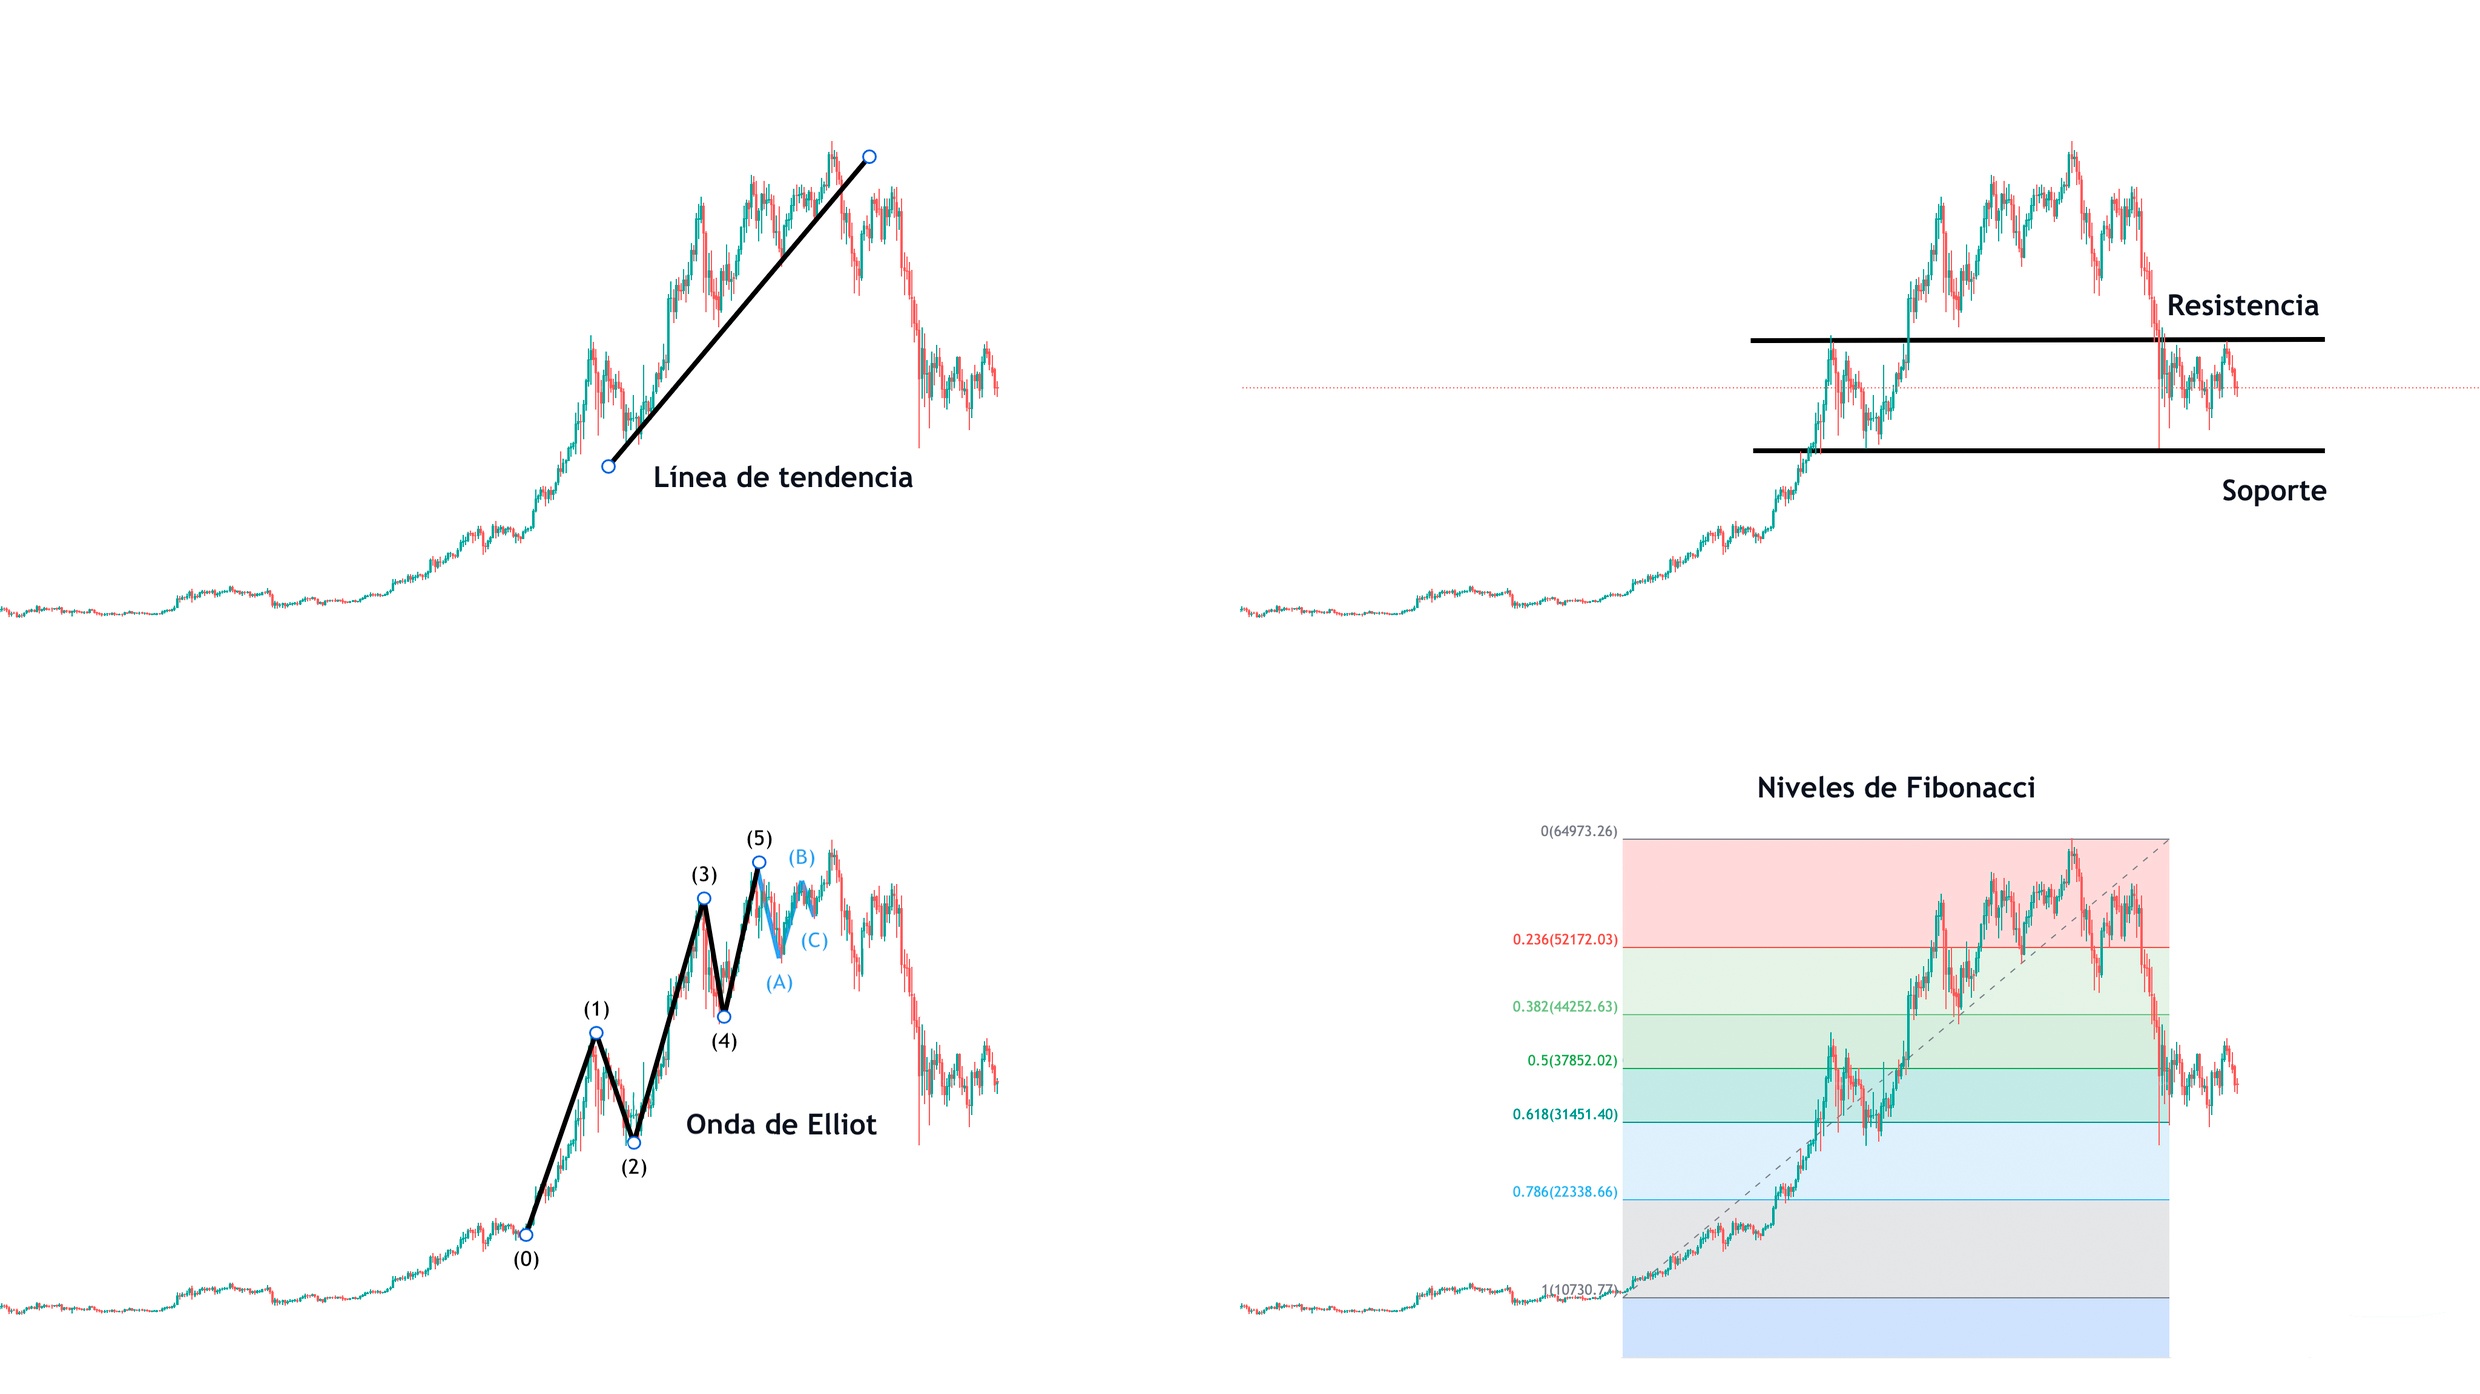
For example, any trader knows that when a very strong resistance level, like an all-time high, is broken, it’s very likely the price will gain more momentum. This is just one example, but these tools allow you to easily design a system with a high percentage of hits.
3.2. Market Indicators
The problem is that there is no rigorous consensus on how to use them because every analyst draws these elements their own way. So, if you want more unified buy and sell signals, there are market indicators. These are simply charts plotted with mathematical calculations that give the same signals to both you and me.
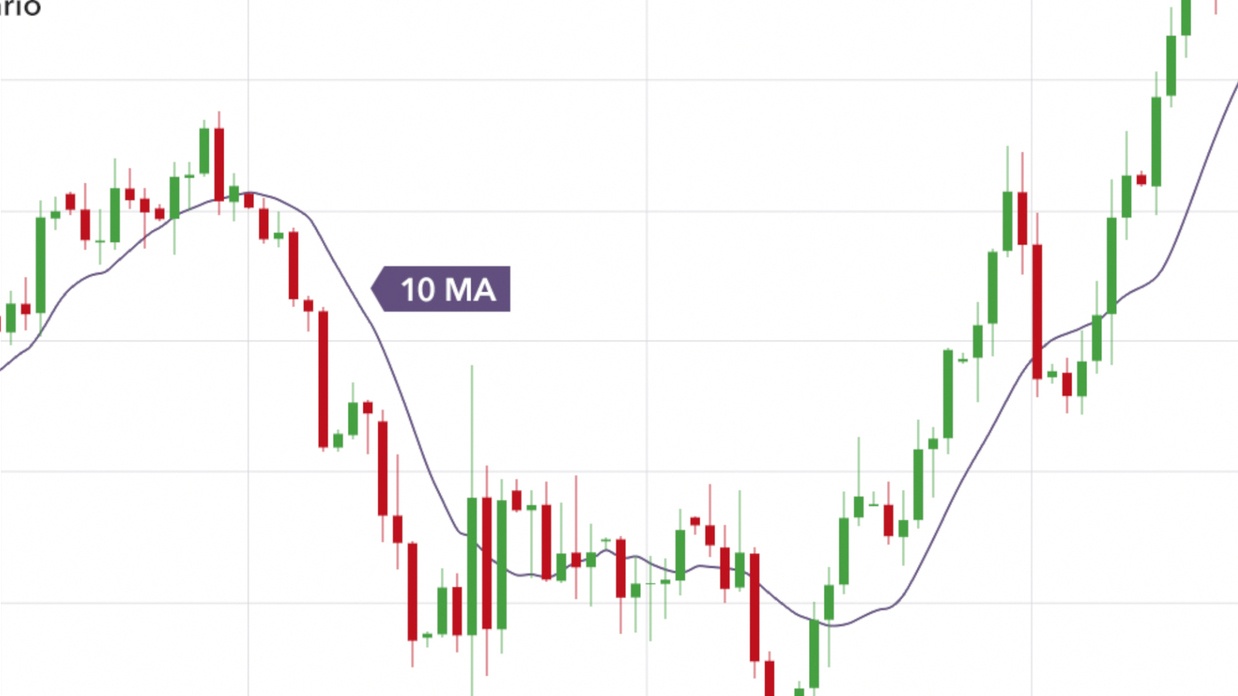
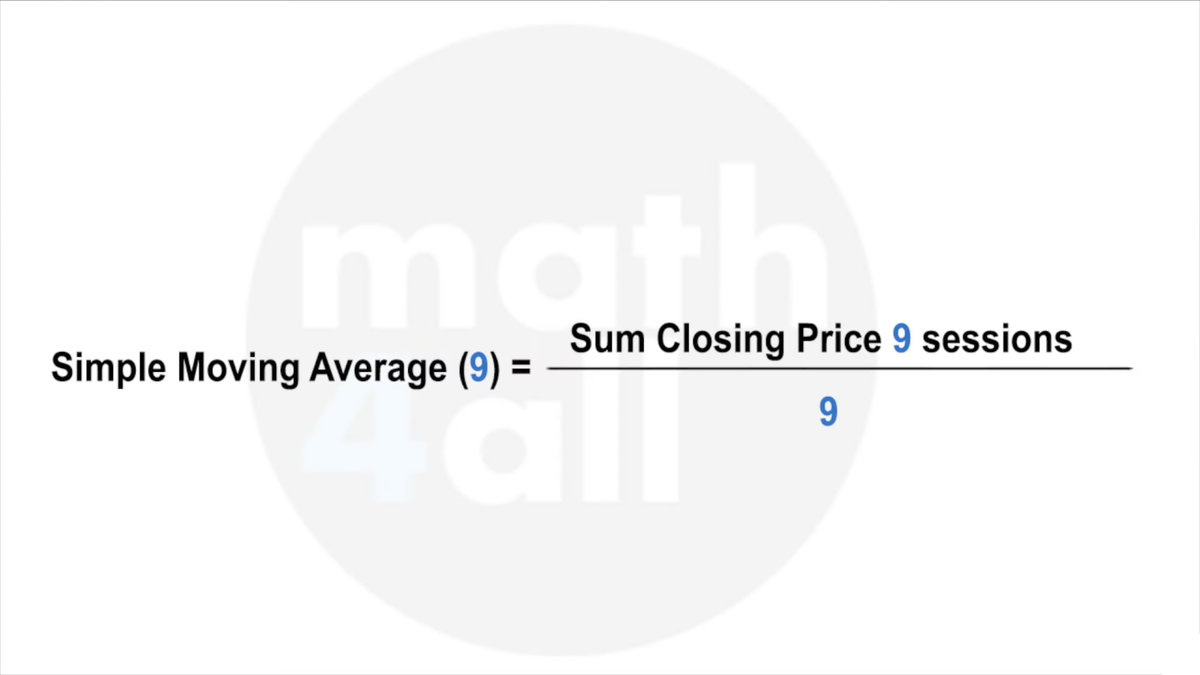
One example is the moving average, which is simply a line where each point is calculated using the average value of the periods we choose. For example, if we choose a 9-period moving average, each point is obtained from the average of the 9 previous prices. That is, a line of averages is drawn to smooth out the noise caused by short-term factors like news or manipulation. The moving average summarizes the general information better and is visually useful.
Screenshot
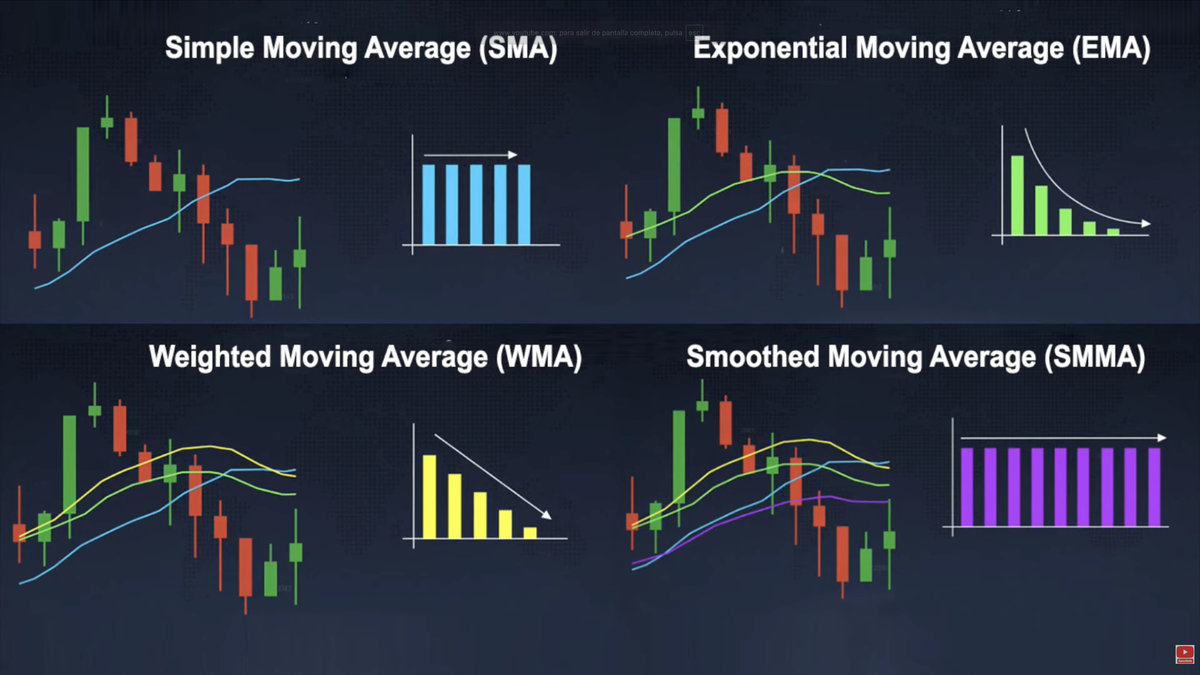
There are different types of moving averages, and they differ mainly in the priority they give to the values of those averages. Most indicators use exponential moving averages because they give more importance to the latest price values.
Screenshot
But getting back to the topic, would you like to see an indicator?
Screenshot
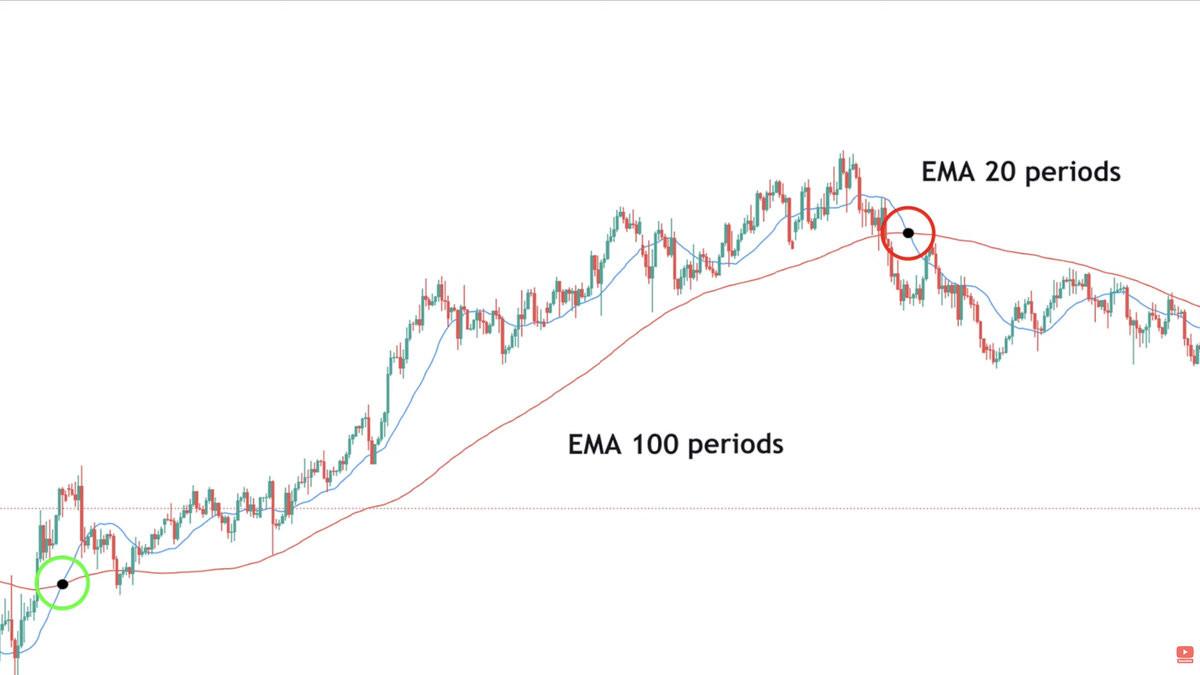
The simplest one is a moving average crossover, where two moving averages of different periods are superimposed—one faster and more sensitive line with fewer periods, against one slower and more stable line with more periods—and the relationship is studied. Can you imagine how?
The crossover points represent moments where the short term diverges from the long term, thus indicating a possible buy or sell.
Note that when they cross, there is usually a change in price. However, notice there is also a lag.
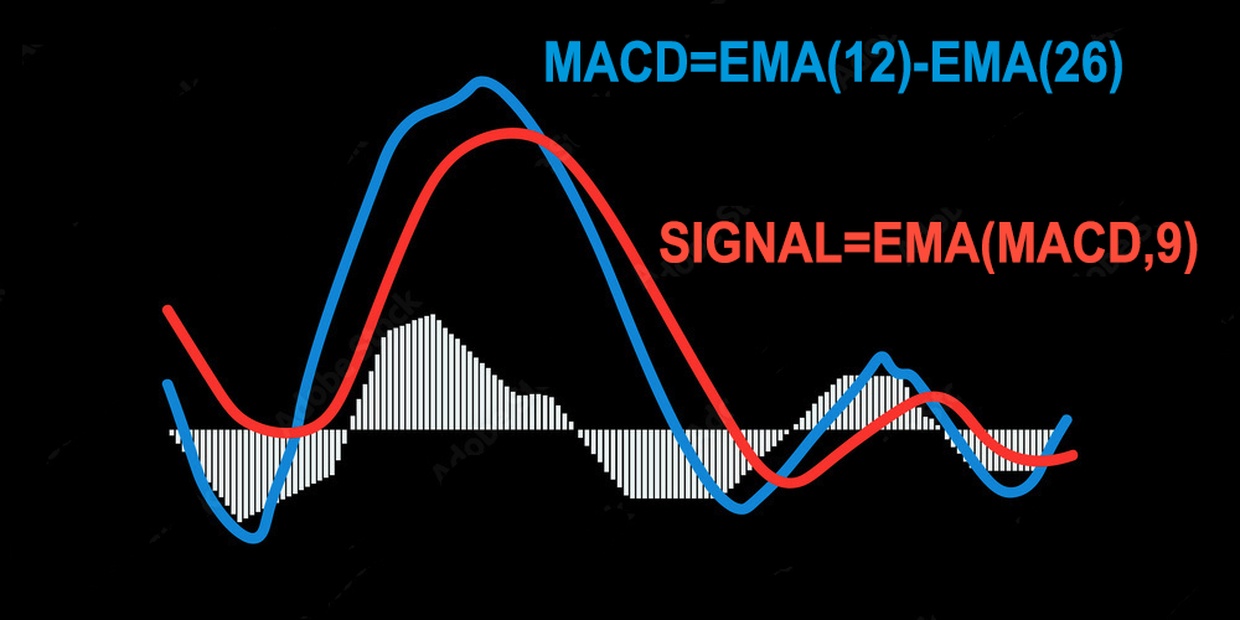
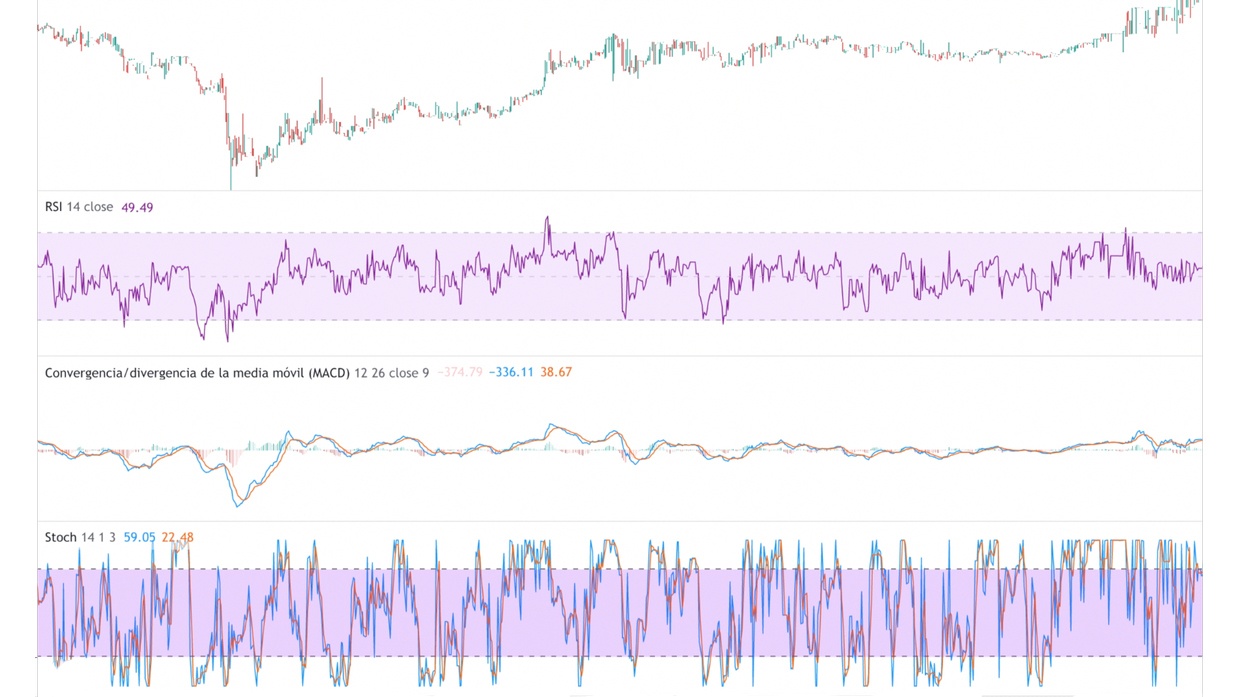
Another common technical indicator is the MACD, which looks for another line crossover—in this case, a very fast signal achieved by subtracting a 26-period average from a 12-period average, with a slower signal achieved by smoothing this with a 9-period average.
Screenshot
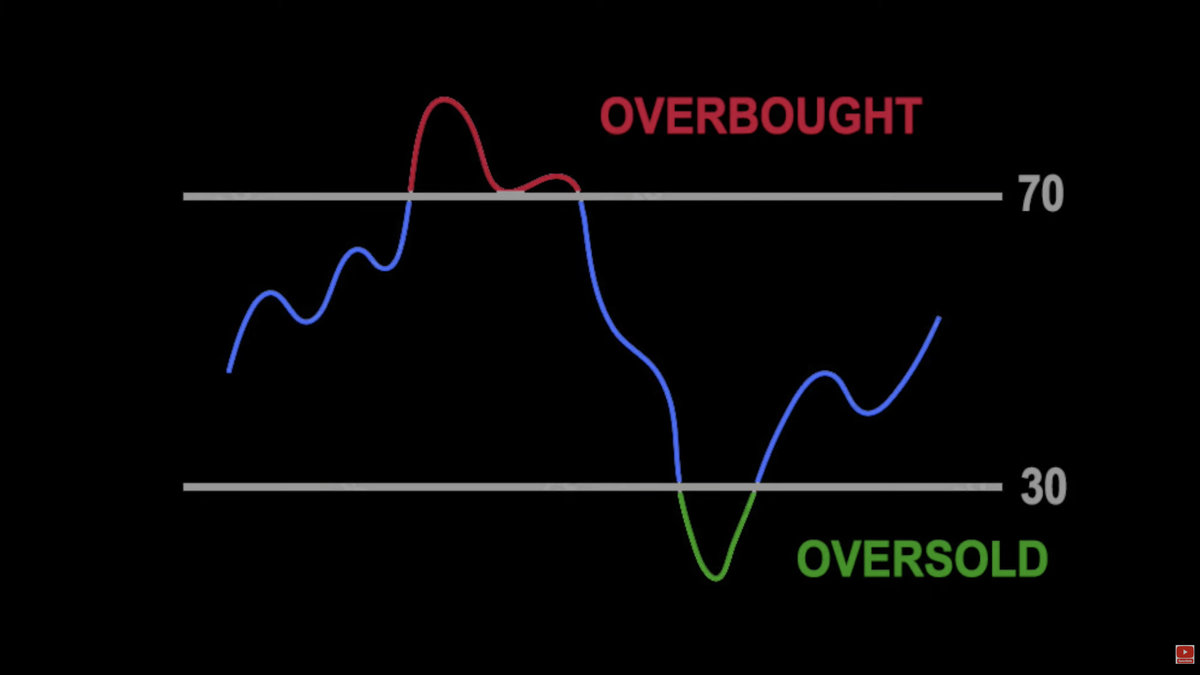
Then there is the RSI or Relative Strength Index, which indicates if an asset is considered overbought or oversold when it reaches levels above 70 or below 30.
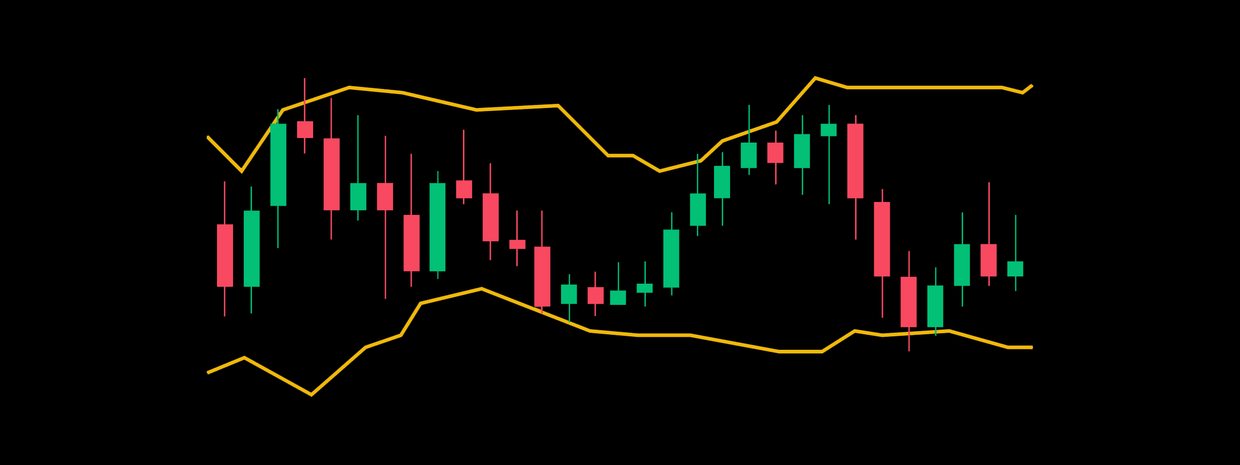
Nevertheless, there are also indicators created by mathematicians, such as BOLLINGER BANDS, which represent market volatility with their width.
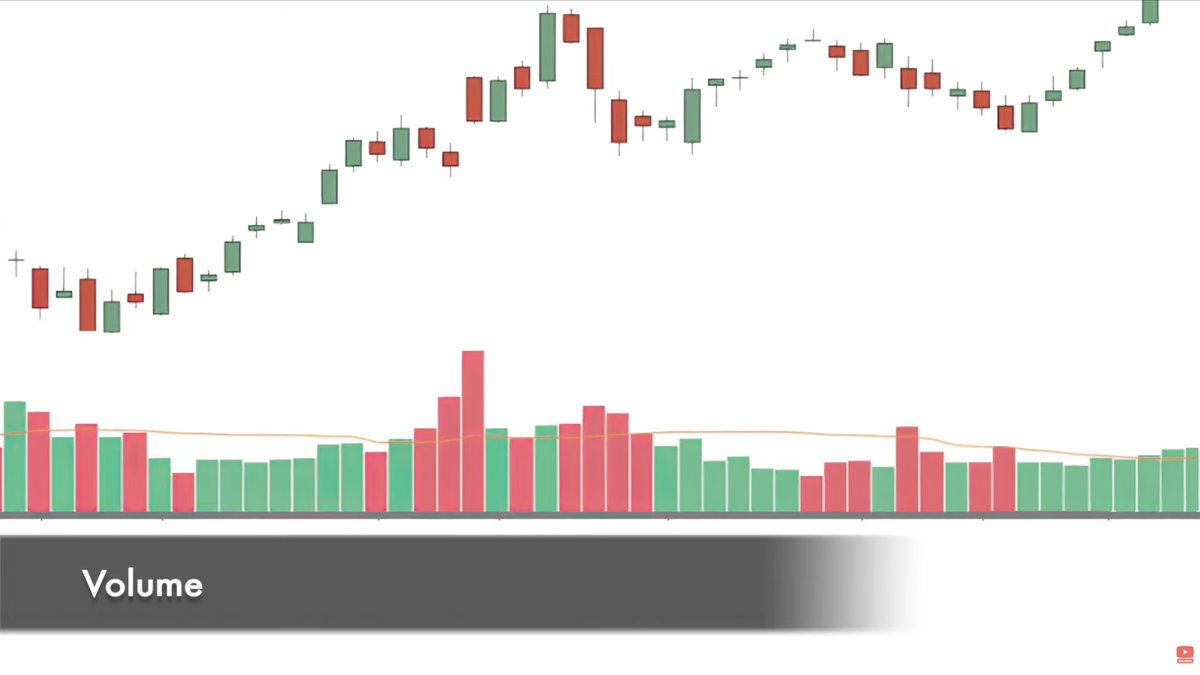
And others like VOLUME, widely used by some traders.
Screenshot
All of these also serve to design systems with a good probability of success, and since many analysts use them, they ultimately end up influencing the price. A bit paradoxical, isn’t it?
The point is that indicators can have some effectiveness, but that doesn’t mean they are always right. Note that in the MACD, when a large trend change occurs, there is a crossover; however, not every time a crossover occurs does the momentum have the same strength. You must be very clear that indicators are calculated from the price and not the other way around, and if the price changes, the indicator changes too because it is drawn with past data. That’s why you must be careful, as price momentum can blow right through any indicator. You’ve been warned!
It’s important that before using them, you know all their strengths and weaknesses well (so if you’d like to learn them, check out the course I have prepared below).
4. Mathematical Expectancy
Note that although we don’t have a crystal ball to predict the price, we have introduced a concept that can indeed make you a winner: Statistical Success.
It is not necessary to know what the price is going to do at all times to have a profitable system.
But how do we know if it’s profitable? Do you think you can know?
Actually, it’s very simple: a system is profitable when the profit from all positive trades exceeds the loss from all negative trades. In other words, the balance between winning and losing trades is positive.
Simple as that. What were you expecting?
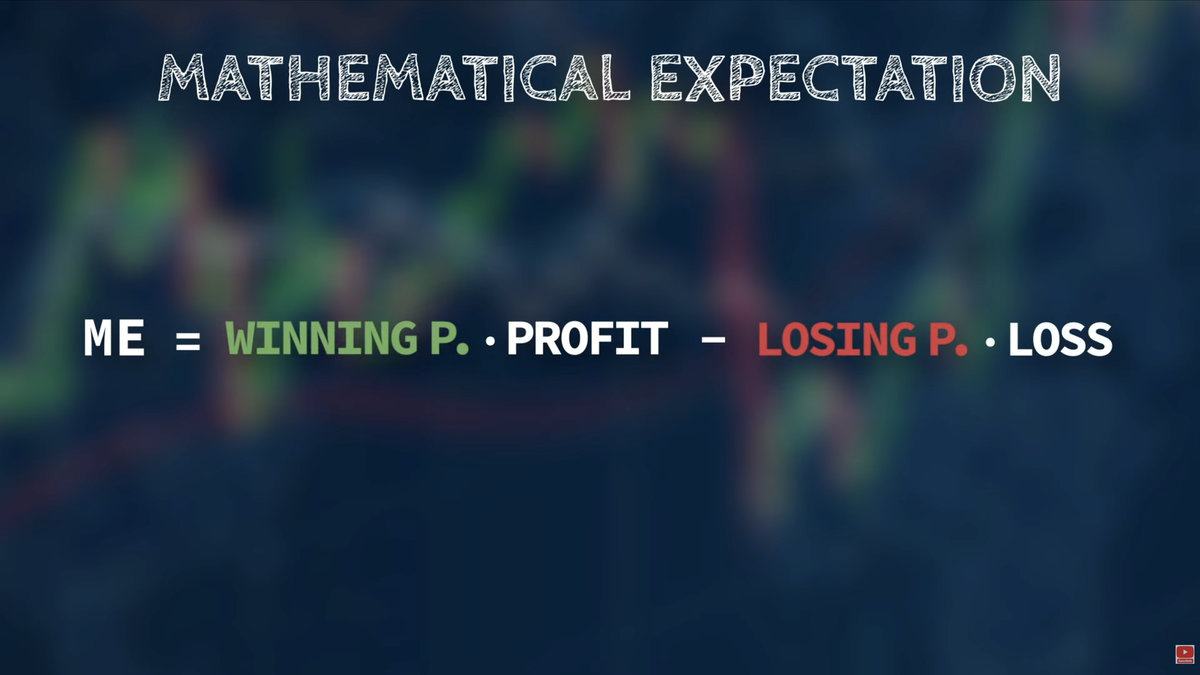
If you summarize that average balance for a single trade, you get the mathematical expectancy of the system. This is how much money you earn on average per trade.
Screenshot
It is calculated using the win rate (percentage of winning trades) and the risk-reward ratio of all of them.
Let’s look at an example:
Screenshot
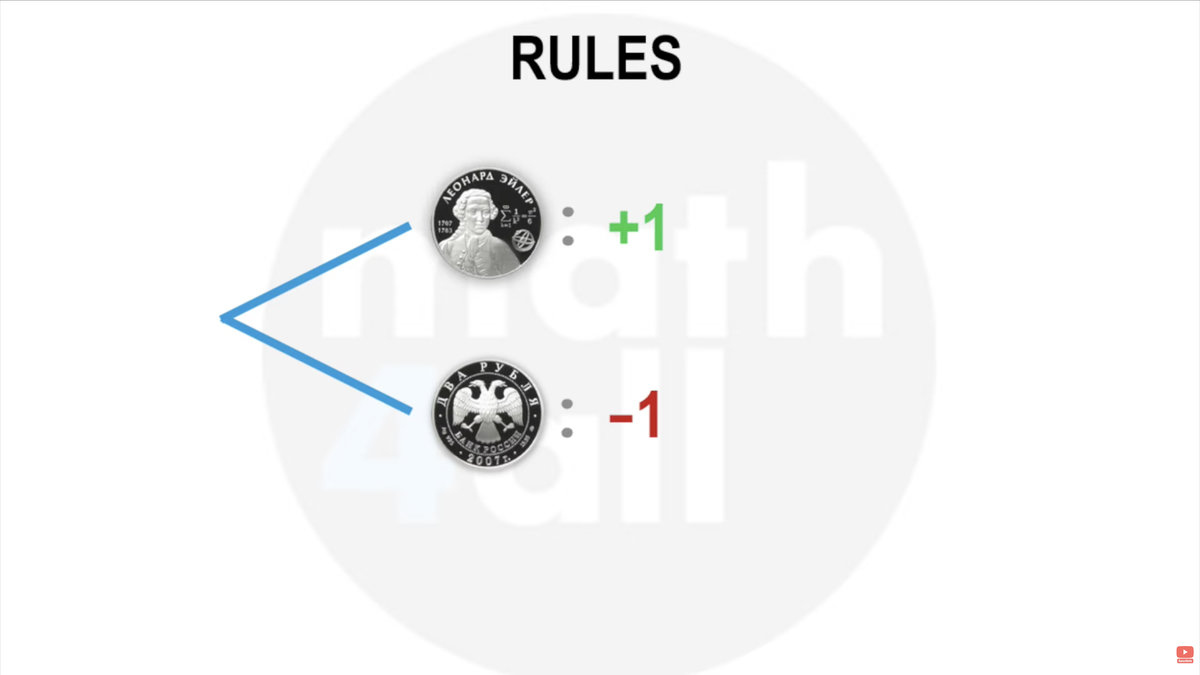
Imagine your system was like flipping a coin with 2 rules. If it’s heads, they pay you another coin, but if it’s tails, you lose your coin. This means your risk-reward ratio is 1 to 1 (1 coin you can win for every 1 coin you can lose). Since the probability of getting heads is 50%, the law of large numbers ensures that after many flips, you would have a win rate close to that value, and since the prize when you win is the same as what you lose when you lose, you would have a system that neither wins nor loses. Mathematical expectancy: 0.
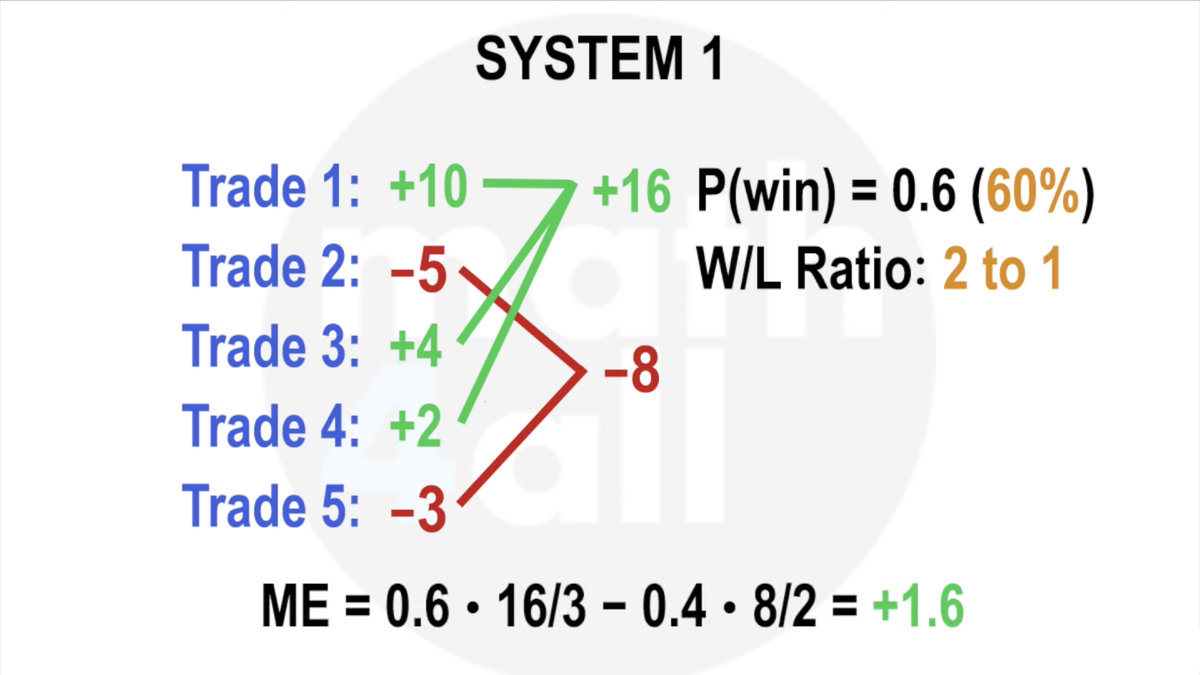
Now look at this other one that makes 5 trades. 3 of them are positive (which is a 60% success rate), and the risk-reward ratio is 2 to 1.
Screenshot
If we use the formula, it has an average profit per trade of 1.6. This means that so far, its expectancy is clearly a winner.
Screenshot
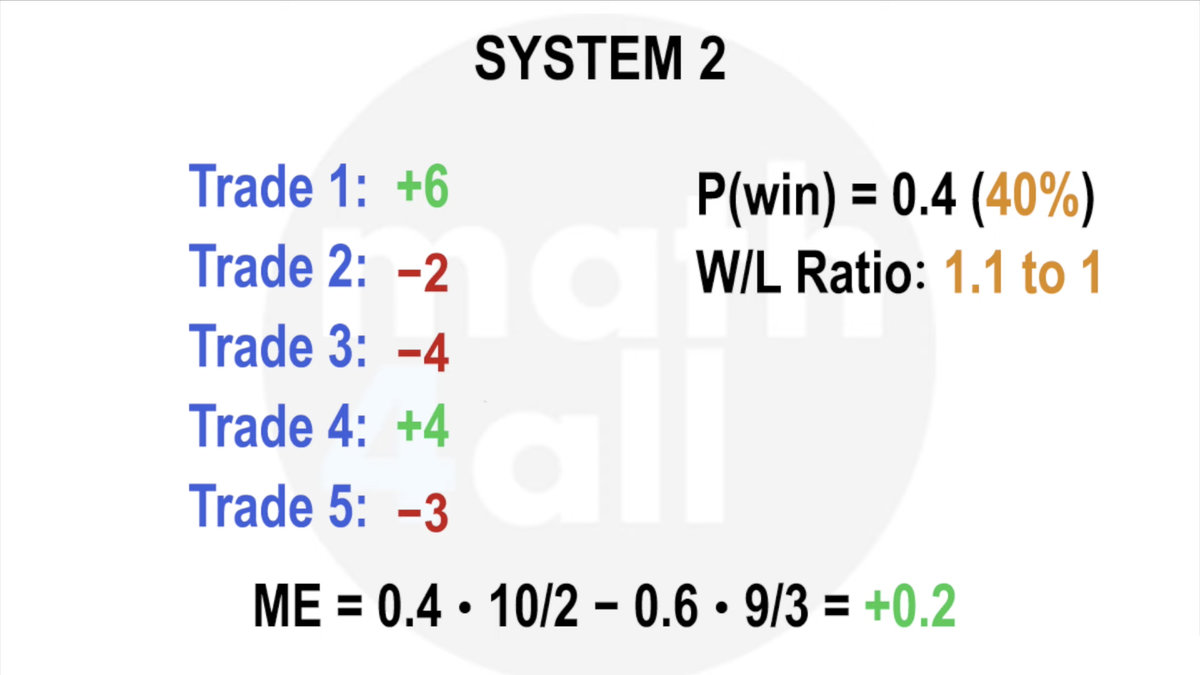
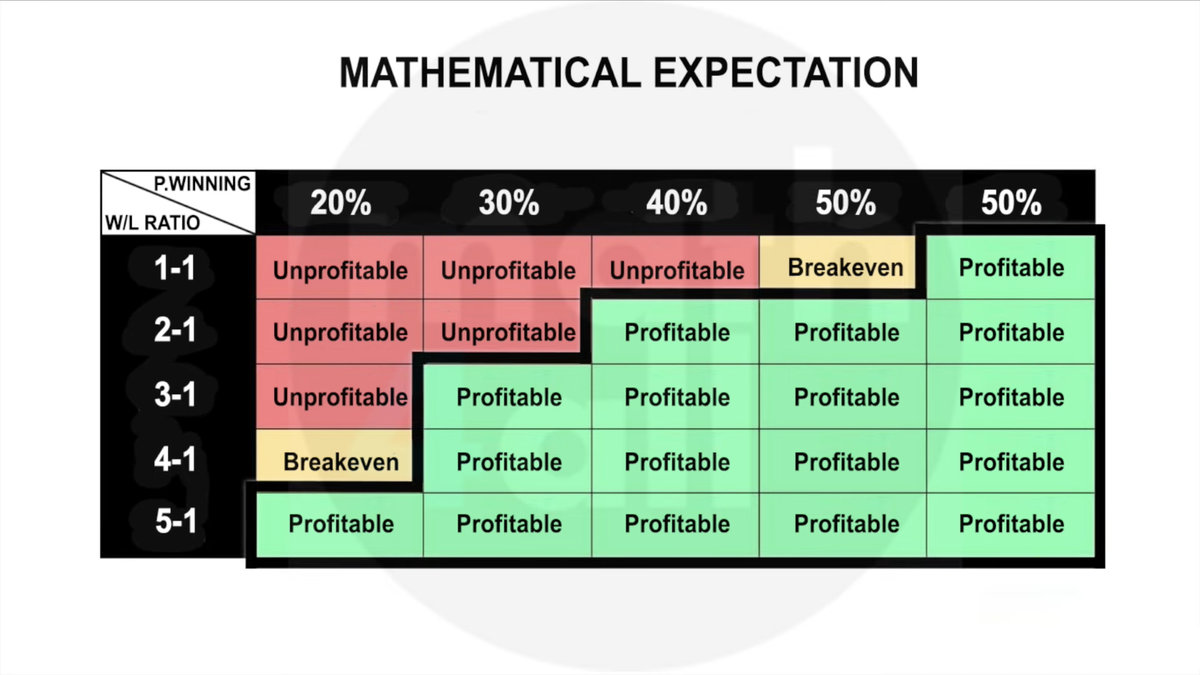
However, if I show you this other one, you might think it isn’t profitable because it has a win rate lower than 50%, right? This is just a perception, because in this case, the ratio compensates for the other variable.
Screenshot
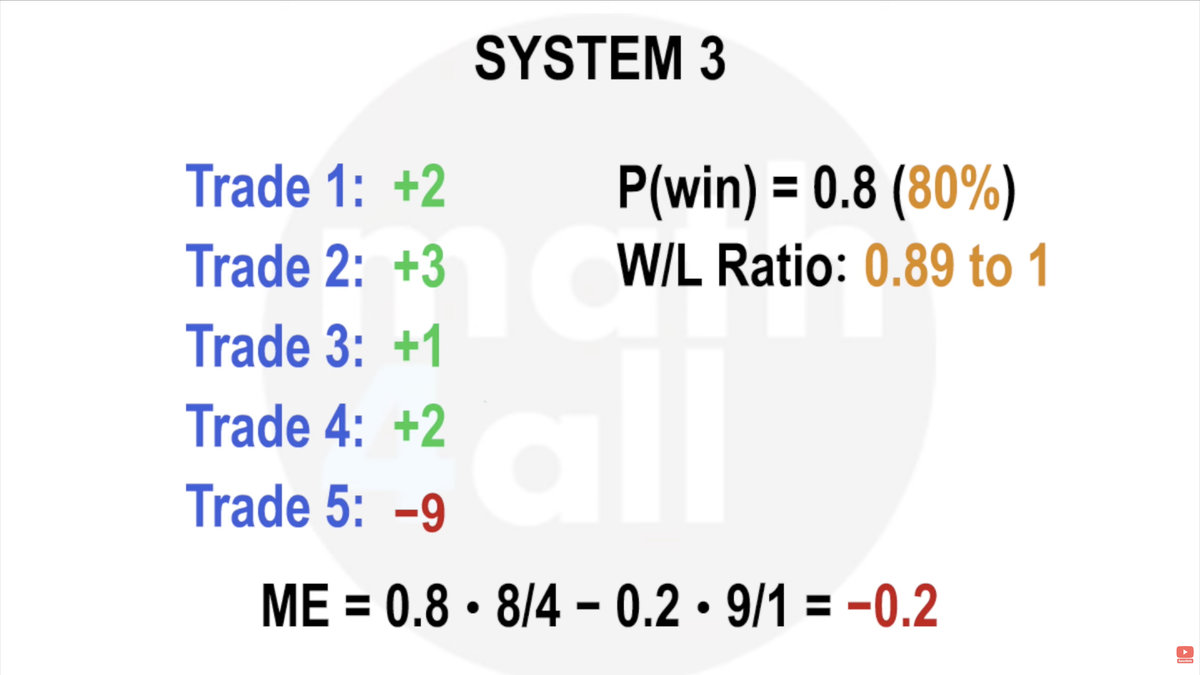
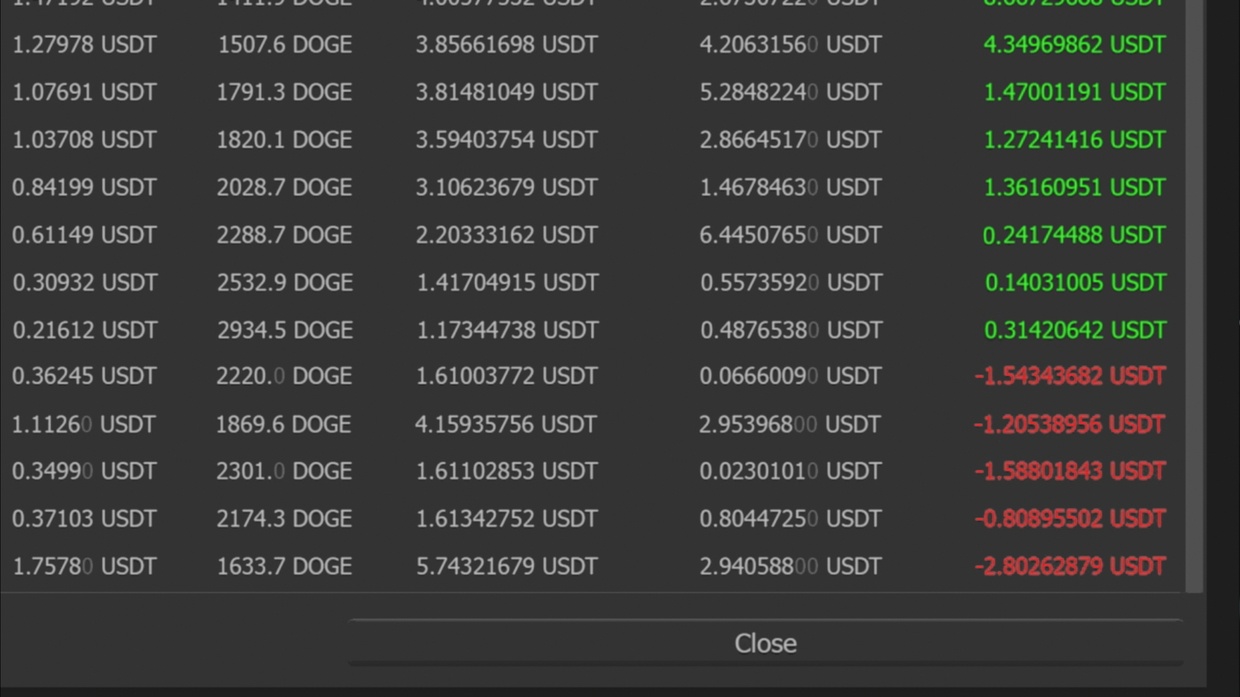
Though the opposite can also happen. Systems with a high win rate may not be profitable if the risk-reward ratio doesn’t ultimately compensate. I tell you this because some people take advantage of this perception to sell you trading bots that have a high success rate but, when they lose, they lose such large amounts that it stops being profitable. Unfortunately, all the profit up until the catastrophe is just a statistical illusion, so be very careful.
Screenshot
Always remember that a system is a winner only when its mathematical expectancy is positive, and not just because of one of the two variables separately.
5. The importance of data in trading
But if you are a good observer, you would tell me that 5 trades are not enough to guarantee a certain confidence level, because for that you need a much larger sample of trades. And the truth is you wouldn’t be wrong; to obtain decisive conclusions, it is necessary to test any system first in a simulator with plenty of data.
So, don’t even think about trading live without knowing your mathematical expectancy well!
But don’t go overboard with the historical data size either. Keep in mind that markets are adaptive and change over time. This means neither the win rate nor the risk-reward ratio will always tend toward the same value, and if you include data that is too old, you may get obsolete conclusions. Remember that statistics show us how the system has behaved up until the current moment, but not how it will do in the future. That’s why it’s more interesting to see how they evolve than to draw conclusions from useless data.
6. Risk Management
Now you have a way of knowing when a system is profitable, but… is it enough to win?
The answer is no, and mathematics will prove it to you.
6.1. Risk of Ruin (RoR)
Even if your system is very good, if you risk too much per trade, you will likely lose.
Returning to the previous example, even if you have a 60% win rate, if you risk a lot of capital on each trade, a negative streak of trades is enough to wipe out your account. Because 60% isn’t that decisive, and it could happen even if you had a 99% rate.
The key is knowing that probability of going broke, which is precisely the probability or Risk of Ruin (RoR). This depends on the system parameters you already know, but also on the risk you want to assume. The more your system risks, the greater the possibility that a series of negative trades will ruin you. (In fact, this relationship is exponential).
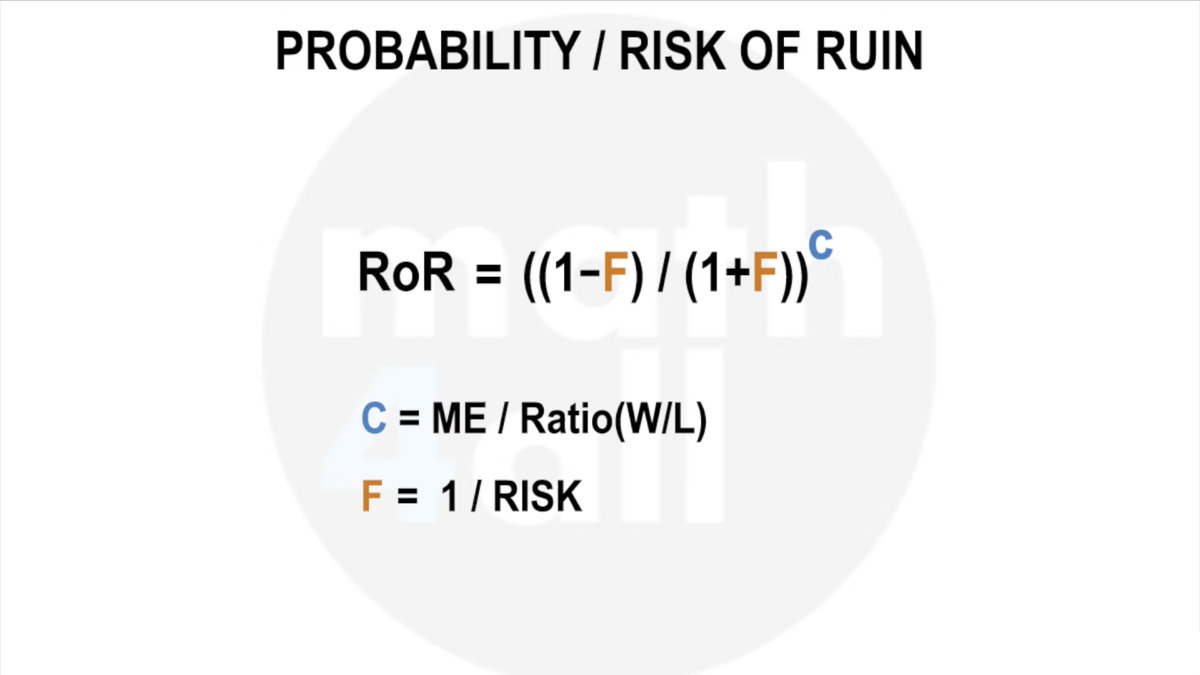
Screenshot
So, having a positive mathematical expectancy isn’t enough!
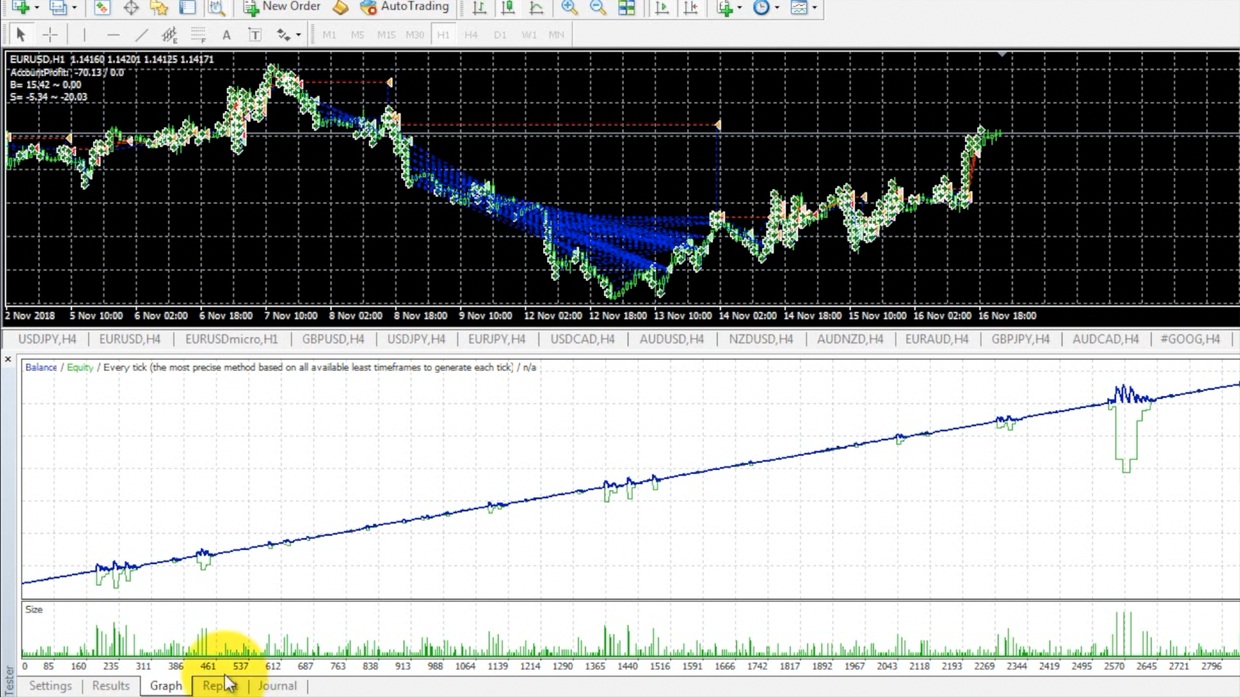
To fully convince you, I’ve created a trading simulator where you can test all these concepts. I’m going to input a system that is profitable on paper, but with a quite high risk per trade, for example, 40%. You can see that what seemed like a winner turns out not to be. Surprise!
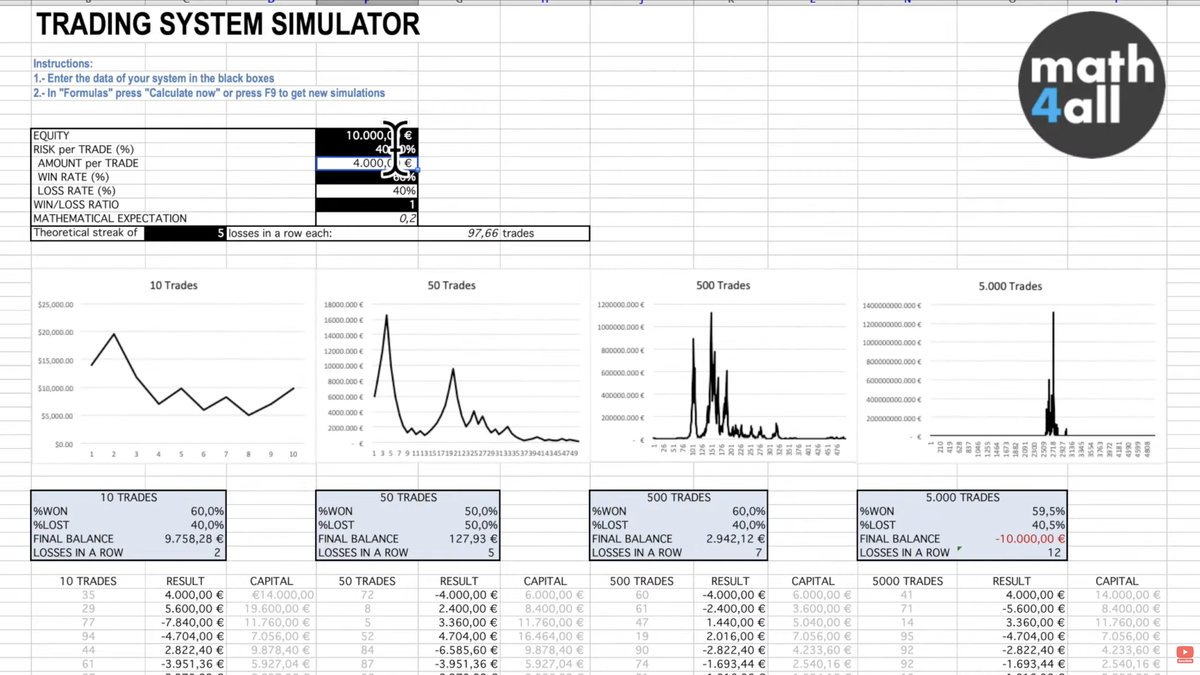
The truth is many systems with positive expectancy can still ruin you if you don’t have proper risk control. Because even if they are winners in the long run, expectancy doesn’t take into account that your capital is limited, and if you go broke, you won’t be able to prove it’s profitable because you’ll have no balance left to recover.
Keep in mind that trading success is based on trading many times, so if you want a future as a trader, you are going to have to control this parameter no matter what.
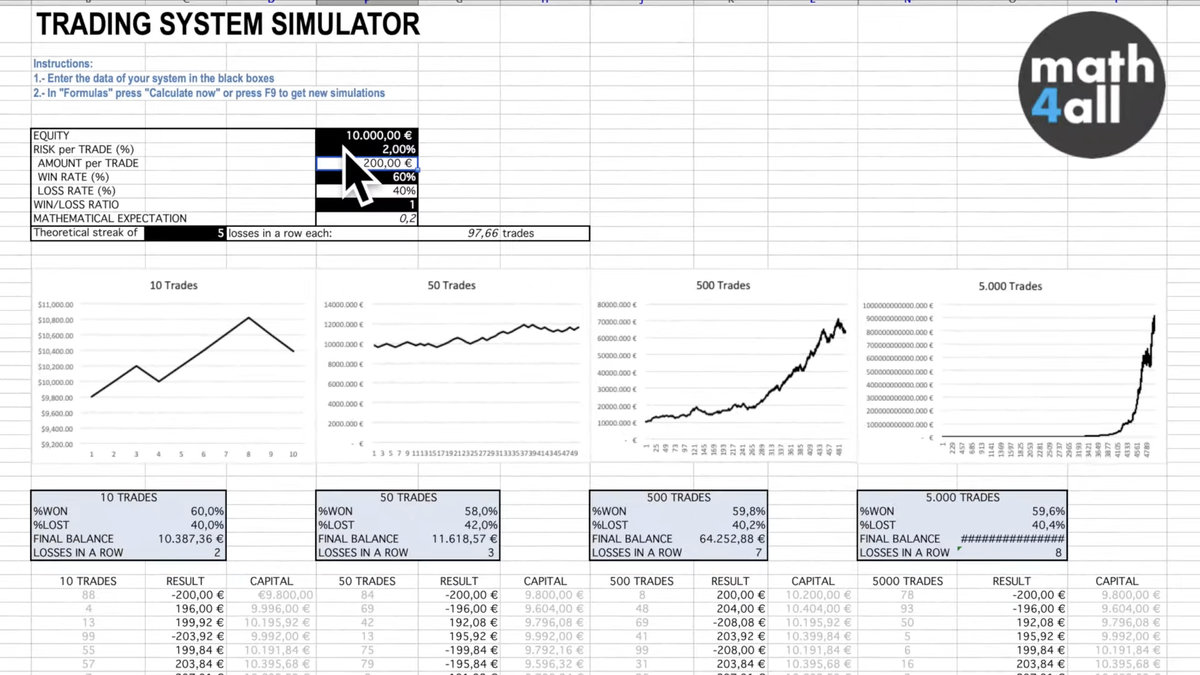
That’s why we’re going to try reducing the risk in the simulator, so you can see that this time the system can make you invincible in the long run.
You’ve just discovered the holy grail of trading. How about giving me a like or sharing this?
6.2. Optimal Risk
Now you just need to know which numbers are appropriate, so the question you must ask yourself is… exactly how much risk should be assumed?
Years ago, the mathematician Ralph Vince discovered that an optimal risk (Optimal f) exists to obtain the greatest possible benefit, but unfortunately, as you will see, it requires assuming a percentage that is too high.
The idea for not having drawdowns or large drops is to assume a small risk percentage. But which one exactly?
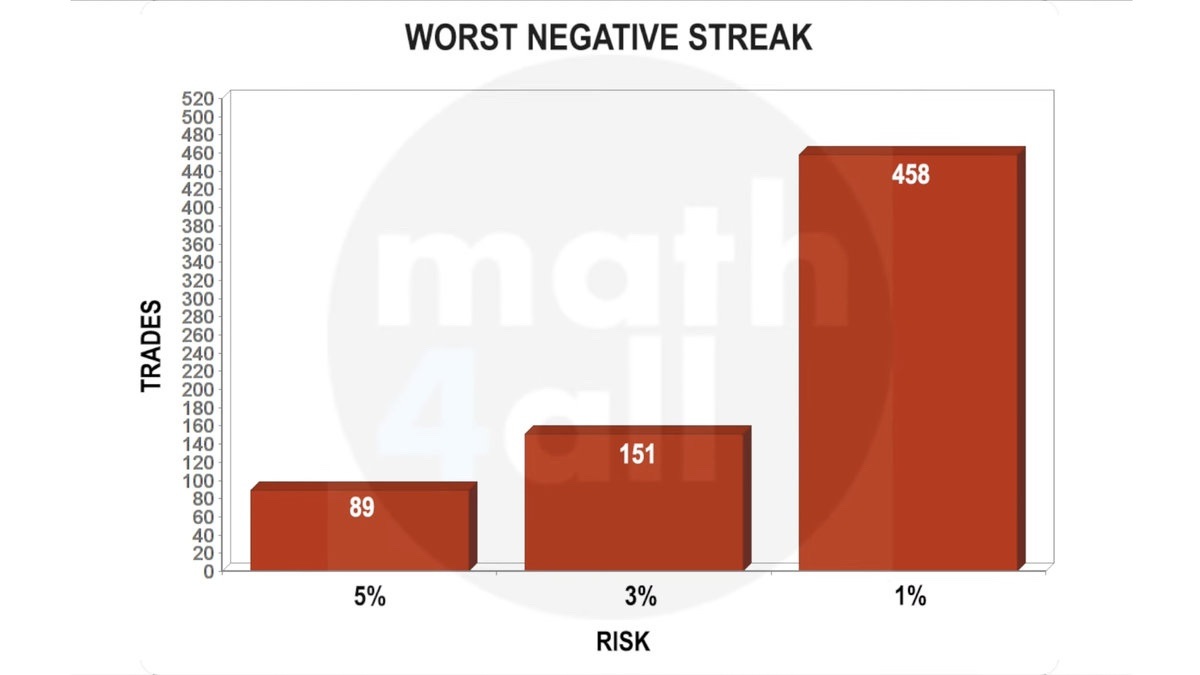
For this, I want you to see a chart where you can see how many consecutive negative trades you need to go broke with some common risks. Notice that a low risk allows you a much larger margin for error.
And while any of these risks could work for you, there is no optimal risk for everyone, because every system is different and every person is different. Everyone tolerates risk in their own way and isn’t willing to risk the same amount for the same benefit. Right?
Higher risk means growing faster, but also more chances of ending up badly. So depending on your system and your tolerance, you can assume higher or lower values, but what you can never do if you care about your capital is assume a percentage that puts your account at risk.
Now you know what math is for, but… how do you calculate your entry size for that percentage if you also have a loss limit?
6.3. Calculating Position Size
To calculate the position size for a specific risk and stop loss, we use the following formula:
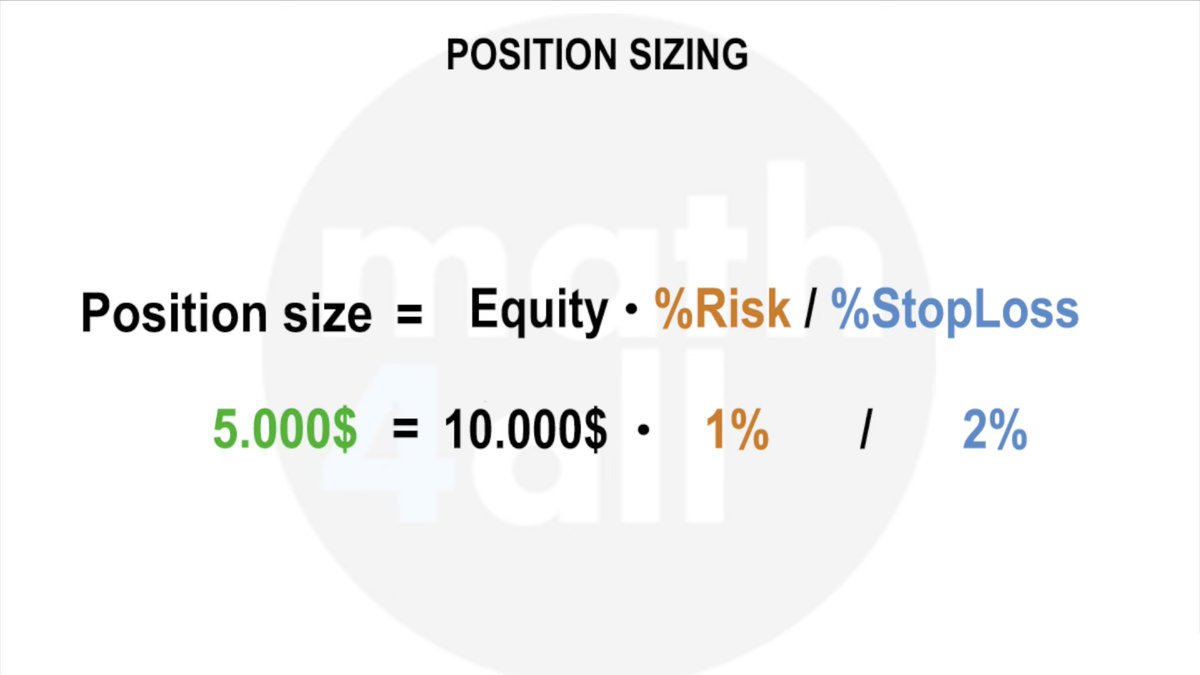
Screenshot
Where we input both parameters along with the capital, and it calculates the exact amount to invest.
In practice, this is adjusted manually by setting the stop loss and adjusting the entry to get the risk percentage we want. However, it’s important that you know how it’s calculated.
Now you’ve learned how to calculate the risk for each trade. But… what if you don’t want to assume a fixed percentage? In that case, don’t worry, because variable risk systems also exist.
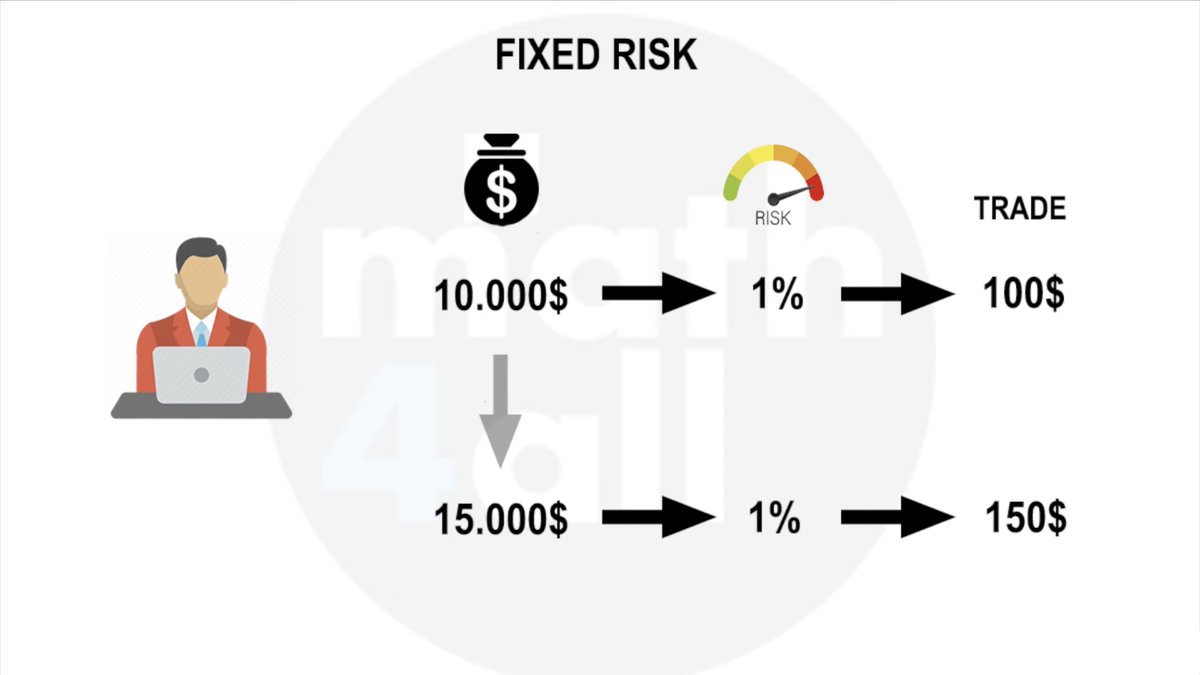
6.4. Variable Risk
Imagine you start with a $10,000 account and a 1% risk (meaning you risk $100 per trade). After some time trading, you manage to increase your account to $15,000. If you keep the same percentage, on the next trade you will risk $150, because it is now calculated as 1% of $15,000. With a fixed percentage, you also risk more when your account is larger, and that means your probability of ruin remains the same because 1% will always be proportional to your account size. What I’m saying is that if what interests you is for your system to become less vulnerable as you grow, then you must use a variable risk system.
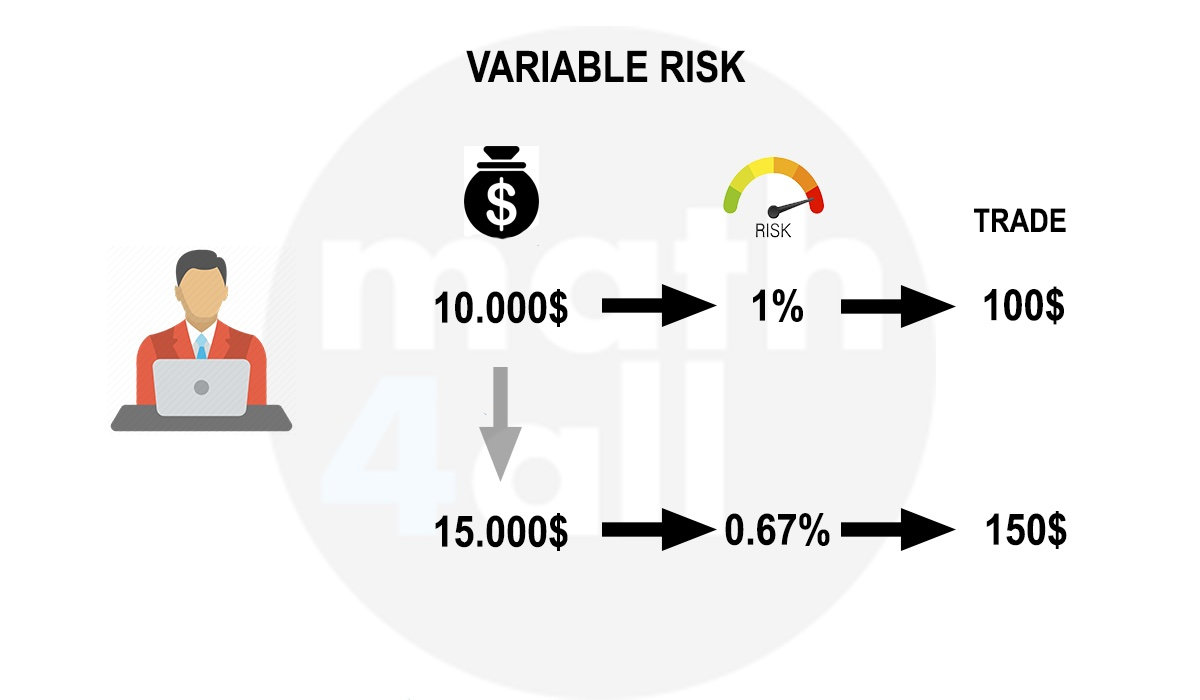
Screenshot
Back to the example, what do you think would happen if in every trade you always assumed $100 instead of 1%? The answer is logical: you would risk a smaller percentage as you grow, and that’s great. But you wouldn’t grow as fast either, because with the same risk, you would always opt for the same profit. So you should only do it if your profit seems sufficient to you.
Assuming the same amount isn’t perfect either, but… do you think it would be possible to reduce risk and increase profit at the same time? Let me know how you would do it in the comments!
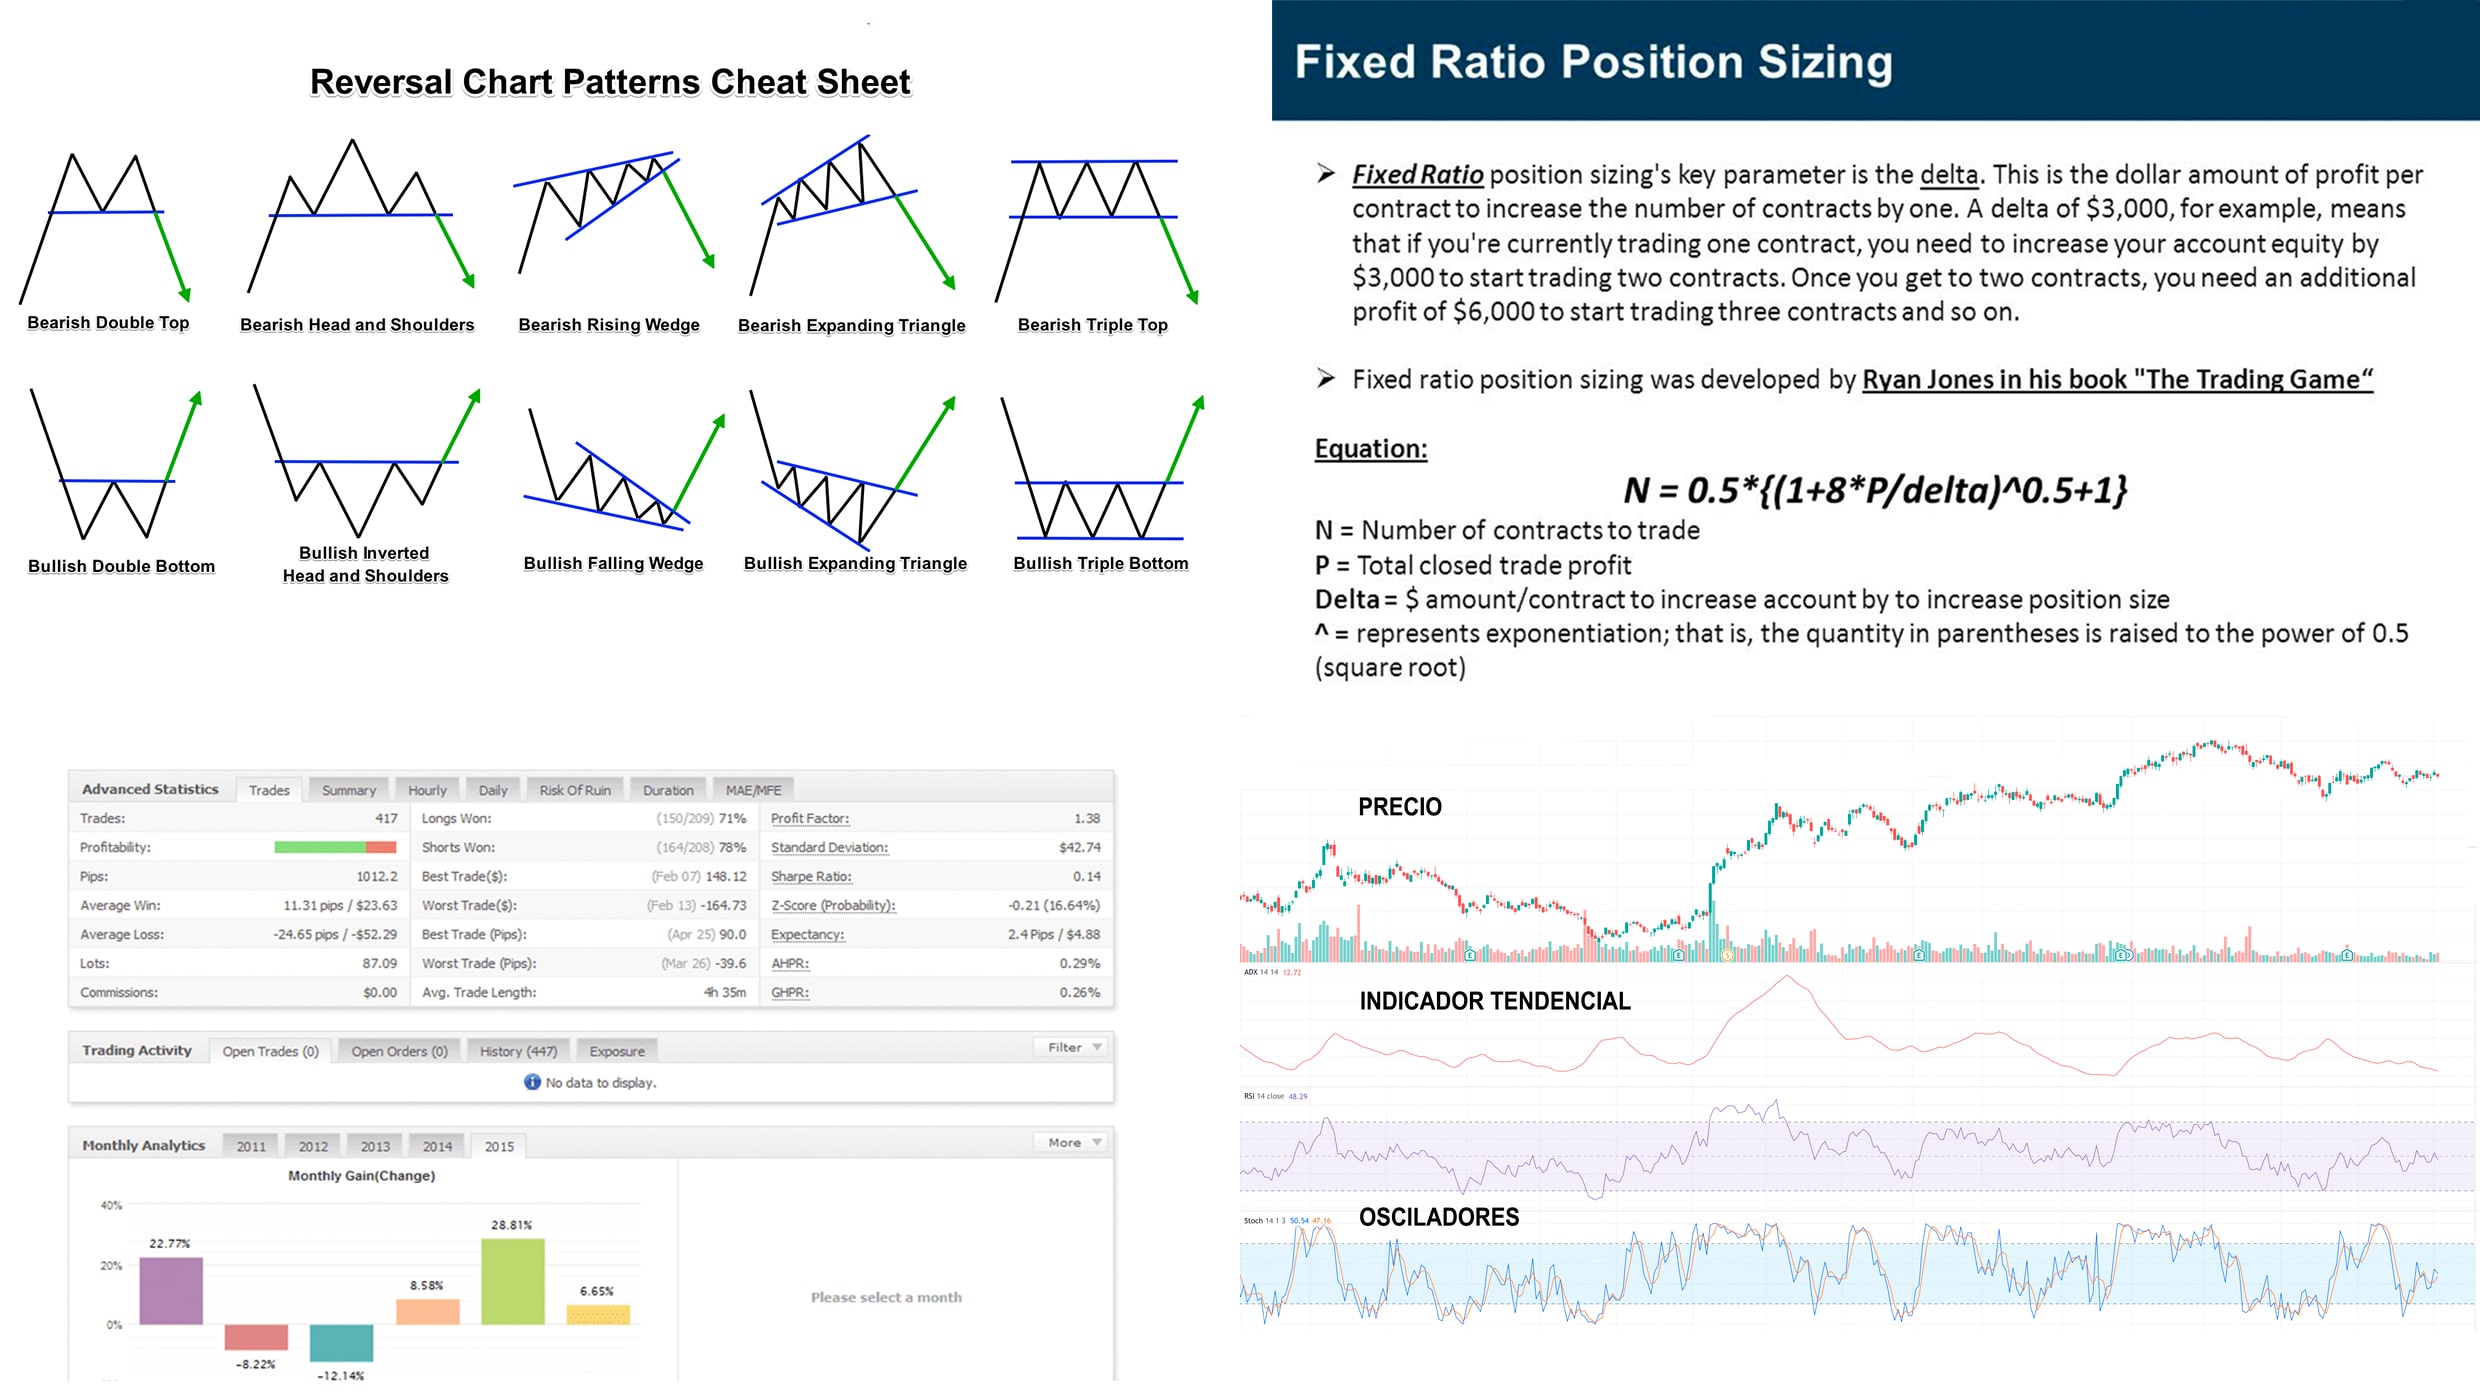
In case you’re interested, there are multiple fixed and variable risk systems like fixed risk or fixed ratio with their pros and cons, which I explain in more detail in my trading course.
7. Parameters of a System
The important thing is that you can now control the most essential variables, although these are not all of them. Mathematical expectancy or risk of ruin are just some of the many parameters used to analyze a trading system.
Within a backtest, many others can be measured, such as the Sharpe Ratio to measure profitability based on risk, or the Z-Score to know the randomness between trades. There are many more, and it’s important to know them in detail if you want to measure your system correctly.
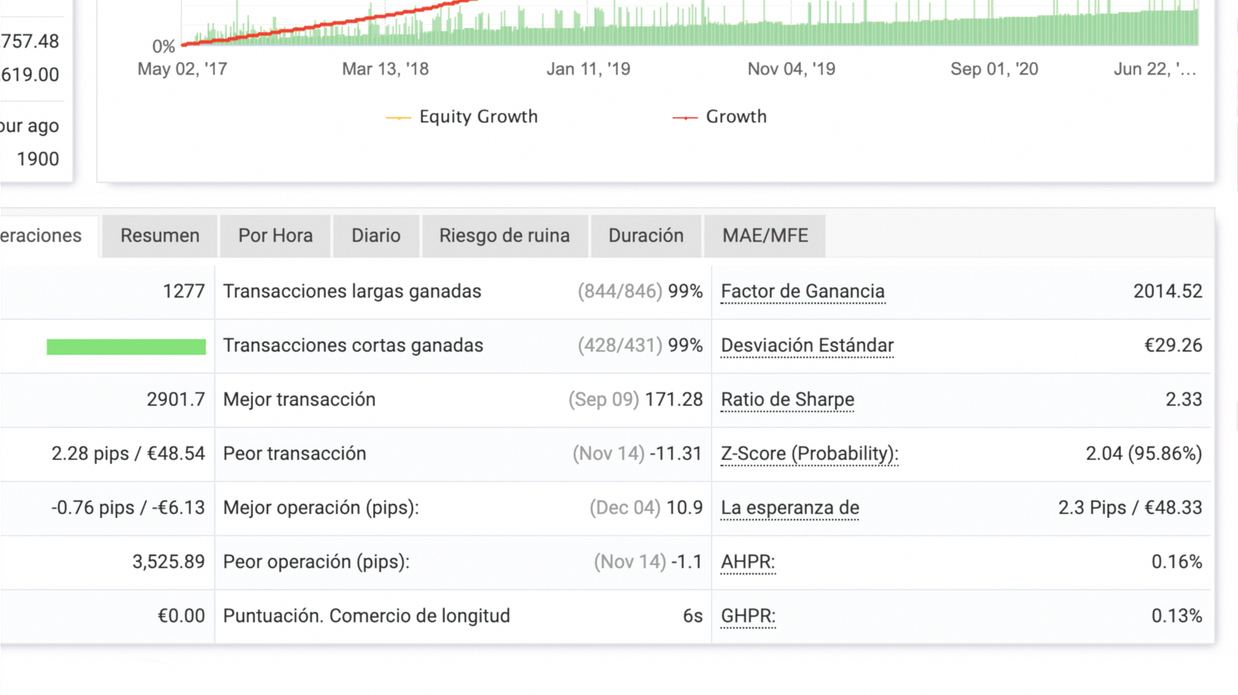
Deciding whether an expert advisor or any system is appropriate or not comes down to evaluating a series of numbers that tell you if it is suitable for your operation or your tolerance. That’s why knowing its mathematics well is so important.
8. TRADING COURSE
If you’ve been left wanting to expand or delve deeper into technical patterns and indicators, discover the different risk systems that exist, or get to know these parameters well, I am developing a trading course where I explain all these concepts thoroughly and with examples. So, if you’re interested in learning trading from scratch with a mathematician, don’t miss this opportunity. I will leave you a link once it’s available.
If you are interested, leave your email in the comments.

See you in the course!